Graphing In R
Plot
The plot() function is used to draw points.
x = 1:10
y = x^3
plot(x,y)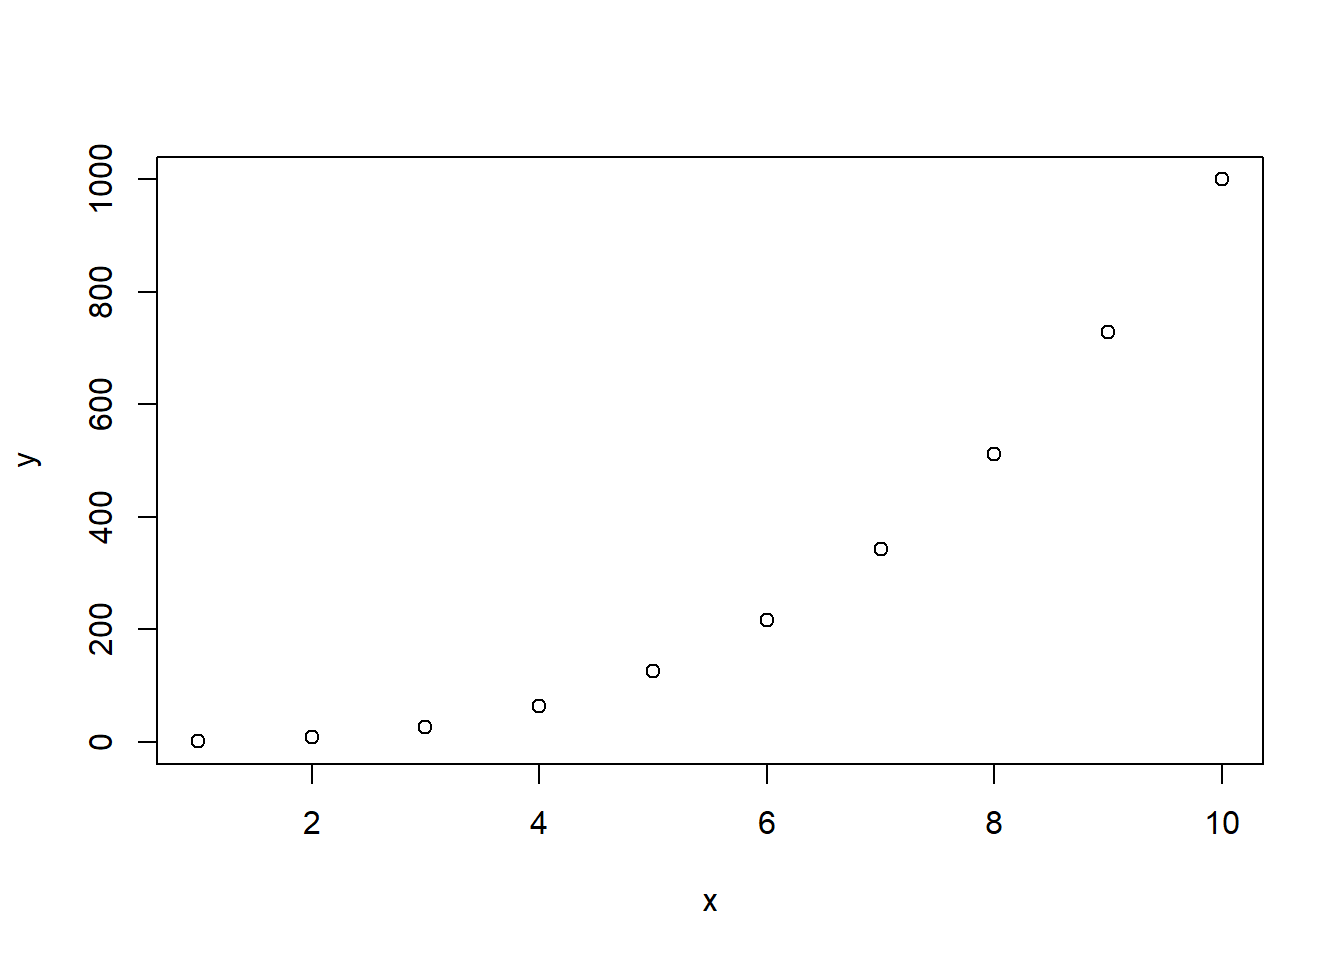
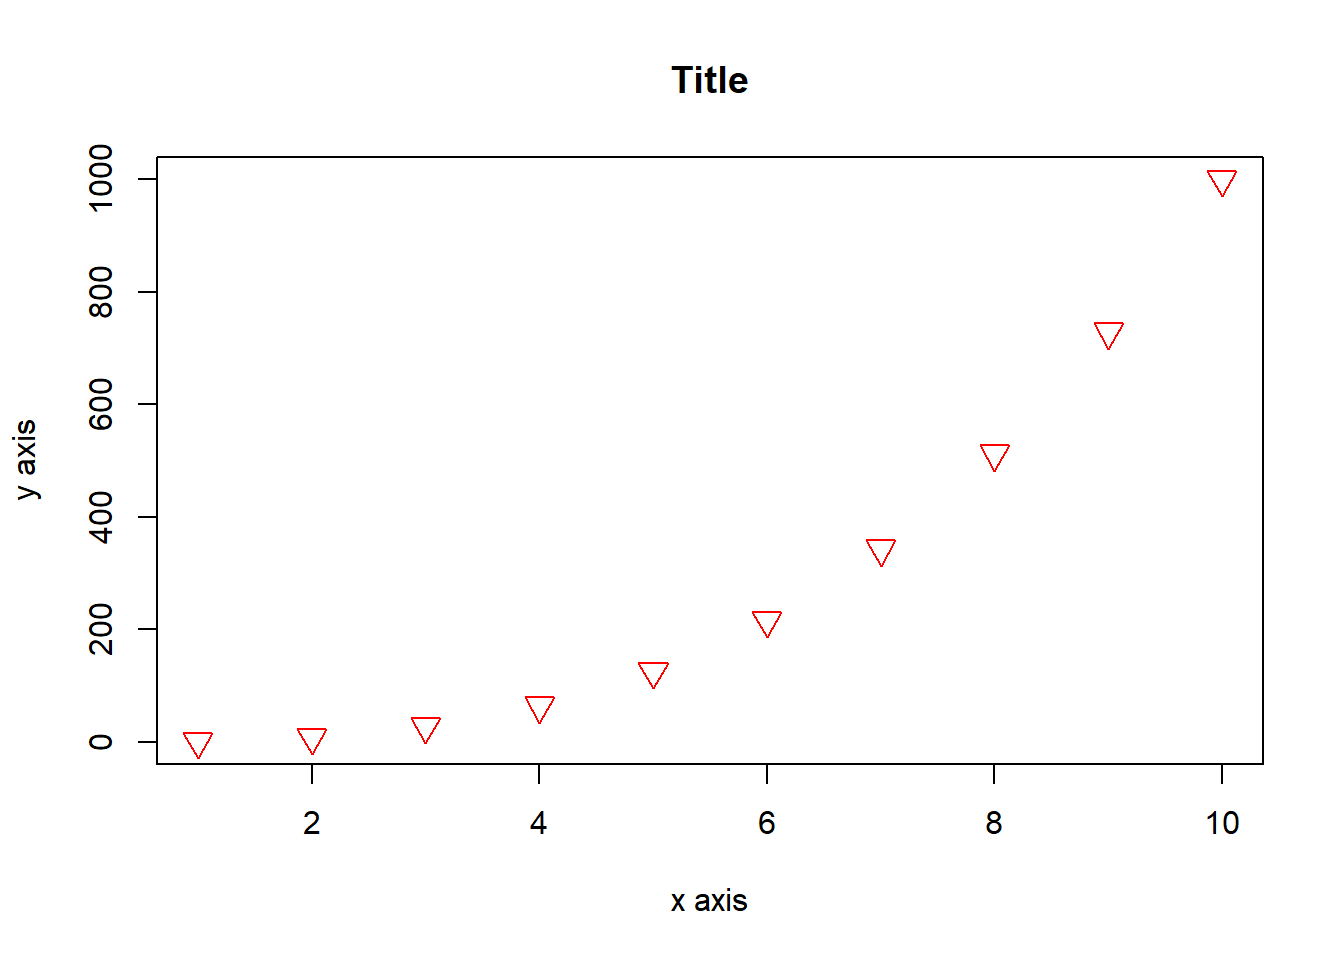
Appearance
There are many parameters to change the appearance of our graph.
x = 1:10
y = x^3
plot(x,y,
main = "Title",
xlab = "x axis",
ylab = "y axis",
col = "red", #Adjusts the colour of the points
cex = 1.5, #Adjusts size, 1 = default, 0.5 = 50% smaller, 2 = 100% larger
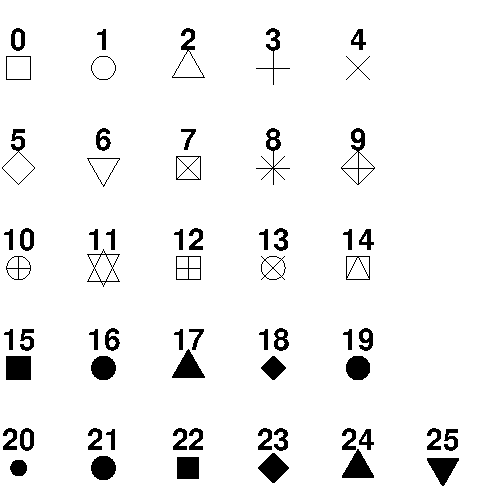
pch = 25 #Adjusts shape of point, valid 1-25
)
Point types below (pch values):
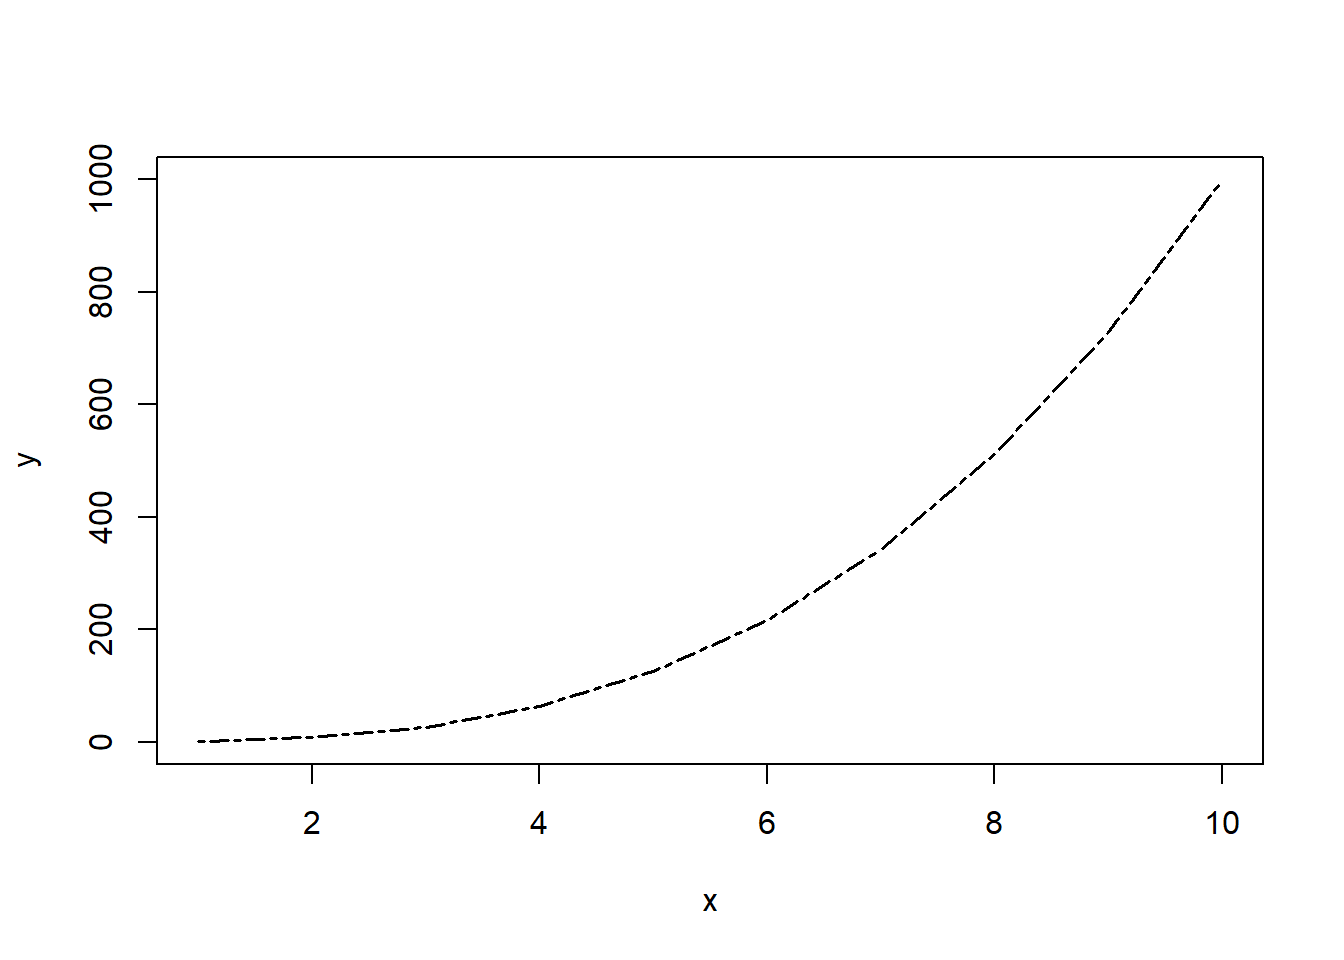
Line Graphs
To make a line graph, add the type parameter.
x = 1:10
y = x^3
plot(x,y, type = "l", # This makes it a line graph
     lwd = 1.5, #Adjusts size, 1 = default, 0.5 = 50% smaller, 2 = 100% larger
     lty = 6 #Adjusts line type, valid 0-6
     )
Bar Graph
The barplot() function will display a vertical bar chart. Use names.arg to label the x axis.
x = 1:10
y = x^3
barplot(y, names.arg = x)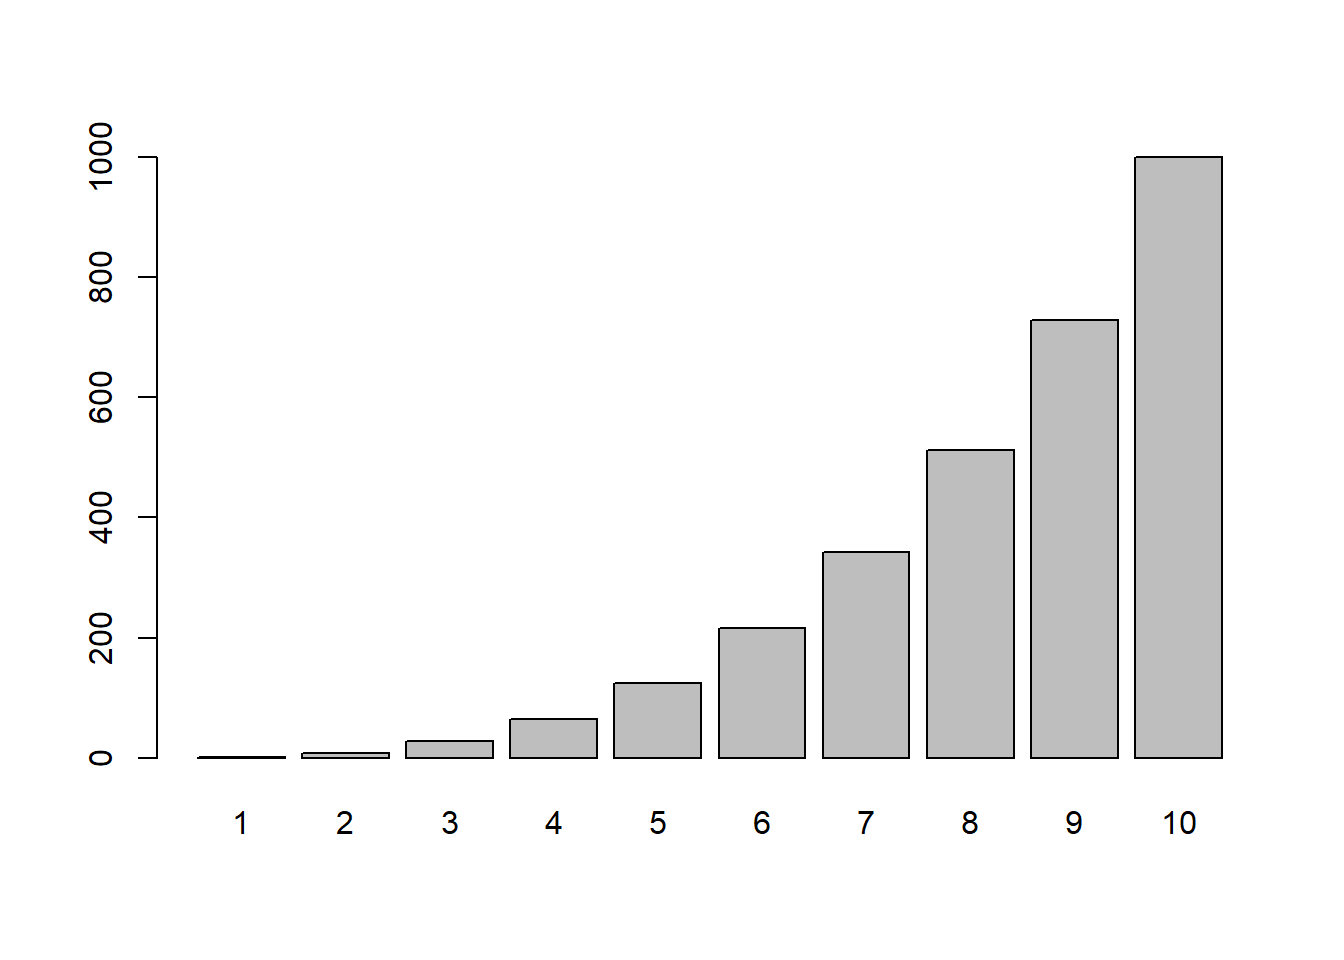
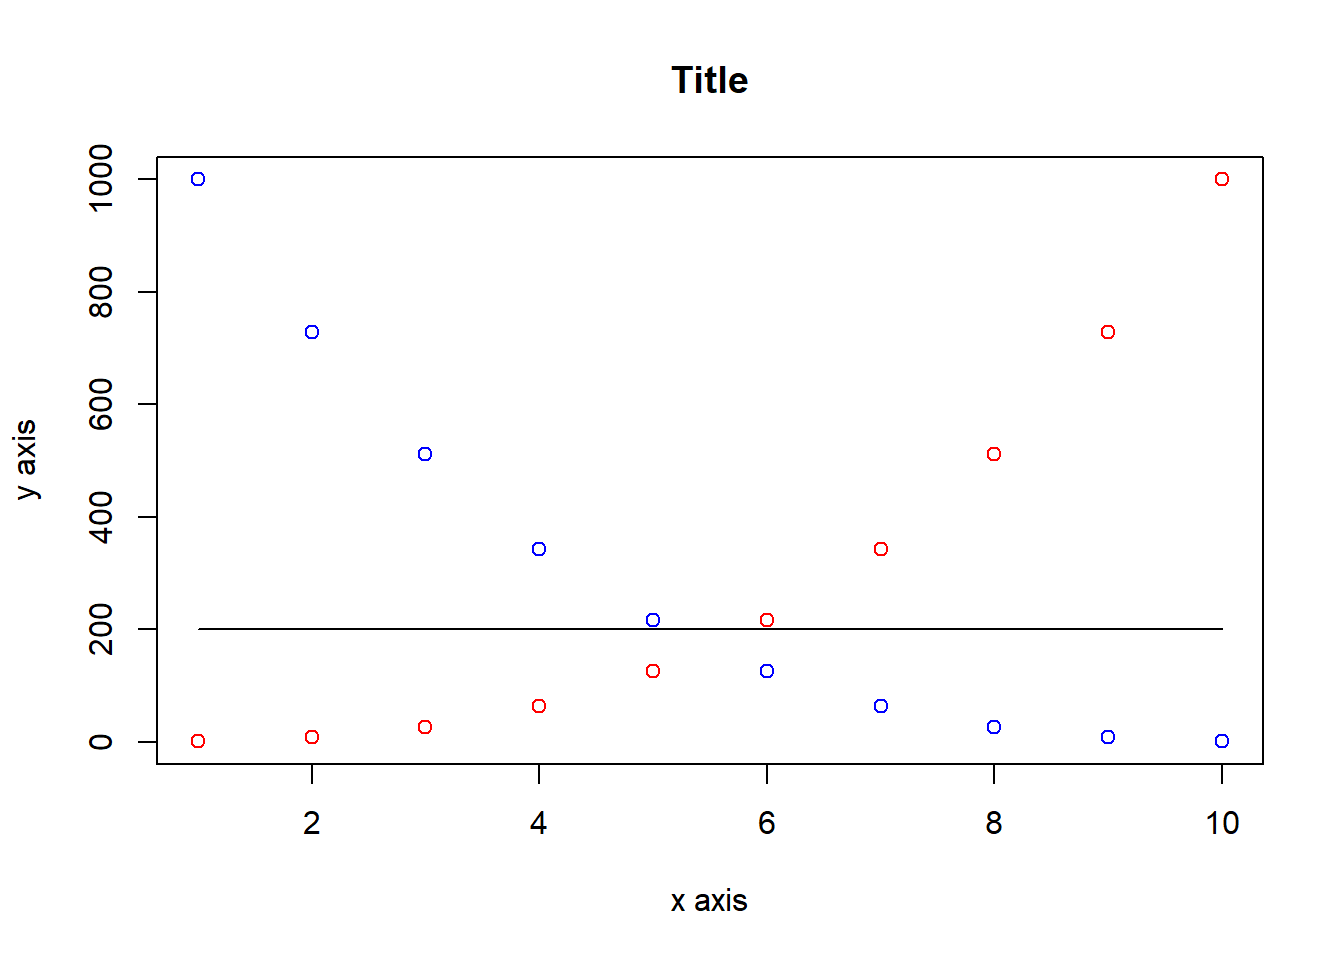
Layers
We can add to existing plots using the points() or lines() functions. Note: a plot (or barplot) must exist to add points or lines.
x = 1:10
y = x^3
plot(x,y,
     main = "Title",
     xlab = "x axis",
     ylab = "y axis",
     col = "red"
)

#Inverting y to create z
z = y[10:1]

points(x, z, col = "blue")

# Create horizontal line
z = rep(200, 10) #'Rep' repeats the integer '200', ten times

lines(x, z, col = "black")